39 B2B Video Engagements,
Measured
Most video industry statistics come from surveys of marketers asked how they feel about video. This is different. It is the recorded outcome of 39 real engagements delivered between 2022 and 2026, measured against each client's own baseline, with the limitations stated plainly at the bottom.
How this was measured.
Every engagement VideoRep documented as a case study between 2022 and 2026 was included, 39 in total. Figures come from three sources: platform analytics the client shared, figures the client reported directly, and delivery records held by VideoRep. Nothing is modelled or projected except where explicitly labelled as a projection.
For YouTube results the measure is performance against the client's own channel median in the same window, not raw view count. A video with 50,000 views is impressive on a channel that normally does 2,000 and disappointing on one that normally does 400,000. Raw views measure audience size; the multiple measures whether the video worked.
For cost figures the measure is what the client recorded as the difference between what they paid and the alternative quote they were holding at the time. These are client-stated, not VideoRep estimates.
Presenter-led video ran a median
4.2x the client's own channel median.
Five engagements had enough channel data to compute a multiple. The spread is very wide, which matters more than the median.
| Client | Multiple of own channel median | Context |
|---|---|---|
| Crush The CPA | 38.8x | Top video, #6 all-time in 8 months |
| Mashvisor | 18.2x | #9 of 310 all-time uploads |
| GoMage | 4.2x | All-time long-form median |
| Coinbound | 3.4x | vs a founder video, same channel, same week |
| Workvivo by Zoom | 3.0x | Top Short, #8 of 63 in window |
| Buildium | 2.6x to 3.8x | Top three explainers |
The median is 4.2x. The mean is far higher and is not a useful number, because Crush The CPA's 38.8x is an outlier that would misrepresent a typical result. The honest reading is that presenter-led video reliably beat the channel baseline in every case measured, usually by around three to four times, and occasionally by an order of magnitude.
Separately, OptiMonk's most-watched long-form video reached 60,264 views, which the channel data put at 94x its long-form median for that year. It is excluded from the table above because the comparison window differs from the others.
The presenter-versus-founder
question, with a controlled case.
Whether a professional presenter outperforms a founder on camera is argued constantly and almost always with opinion. One engagement produced something close to a controlled comparison by accident.
Coinbound published a presenter-led video and a founder-presented video on the same channel in the same week. Same audience, same subscriber base, same period, same promotion. The presenter-led video did 3.4x the views and became the channel's top long-form video since mid-2023.
One case is not a study, and the honest caveat is that topic and thumbnail were not controlled. But it is a substantially better data point than the industry norm, which is a survey asking marketers what they believe. The finding to take from it is narrow and worth stating precisely: on this channel, in this week, delivery quality mattered more than founder authenticity.
The counter-example belongs here too. Meltwater had run presenter tests before this engagement and the footage came back unusable. Casting failure is the real risk in this decision, not the format itself.
$126,000 in recorded production
savings across eight engagements.
Client-recorded differences against the alternative quotes they were holding. Median saving per engagement: $14,000.
| Client | Recorded saving | Measured against |
|---|---|---|
| GNO Partners | $25,000+ | Production cost alternative |
| FX Empire | $25,000+ | In-studio production |
| For Those Who Served | $25,000+ | Full-service agency quotes |
| Suite Solutions Group | $14,000+ | Production cost alternative |
| Enlightened LCS | $12,000+ | Production cost alternative |
| Critical Control | $12,000+ | Full-service agency quotes |
| OtherWeb | $7,000+ | Rotating-contractor route |
| Electric Heroes | $6,000+ | Production cost alternative |
Two things drive the gap, and neither is hourly rate. Batching is the first: Unilever took 14 videos in under two weeks and Critical Control took nine in under seven days, both from single production runs. Per-video cost falls sharply when everything is captured in one session rather than commissioned individually. Removing internal production labour is the second, and it is usually the larger number. Unilever recorded 140+ internal production hours saved; Critical Control recorded 50+; OtherWeb recorded 30+.
Ten of 39 engagements
ran for years, not weeks.
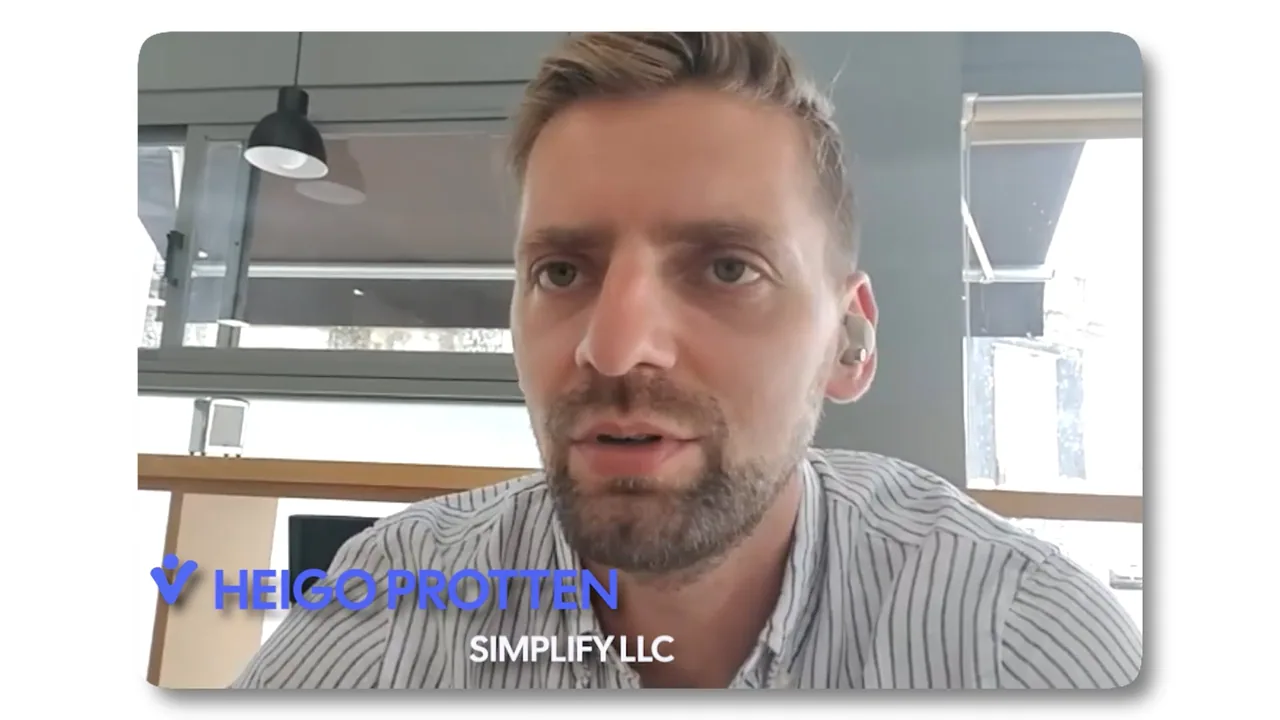
Anagram, Buildium, INFUSE, Meltwater, Microsoft Design, Rezi, Semrush, Simplify LLC, TripleTen and Workvivo by Zoom all show repeat or multi-year work. The longest are substantial: Anagram at 111 finished videos across 36 continuous months, twelve consecutive quarters with delivered work. Simplify LLC at 76 videos over three years. INFUSE at eight separate repeat contracts from a single hiring manager.
That ratio is the most commercially useful number in the study and the one most likely to be misread. It does not mean a quarter of clients are on retainer. It means that when presenter-led video works for a team, the pattern is repeat batches over years rather than a single project, and the same face appearing throughout is a large part of why it compounds.
The mechanism is recognition. A viewer meeting the same presenter across an ad, an explainer and a channel video is not re-evaluating a stranger each time. Simplify LLC's channel reached 3,650 subscribers with a top video at 13,430 views, well past the subscriber base, over three years of one consistent presenter.
Paid results were the most
variable of everything measured.
Reported by the clients running the media, across different offers, audiences and budgets.
| Client | Recorded outcome |
|---|---|
| Syroscape | 78% lower cost per sale than other ad sets on the same account |
| Fyntra | 22 qualified leads in 7 days at $5 to $6 per lead, a 4x lift over AI-only ads |
| Boutique wealth advisory | 3x conversion rate, 2.28x CTR lift (6.64% vs 2.91%), ~50% CPA cut |
| Electric Heroes | 3x+ ROAS sustained on Meta across 22 ad variations |
| BusinessLoans.com | 6+ months of positive ROAS on a single hero ad |
Two of these deserve a caveat rather than a headline. Fyntra's 4x lift is the cleanest comparison because the previous creative was AI-generated ads for the same offer and audience, so the variable really was whether a human was on screen. Syroscape's 78% is measured against other ad sets on the same account, which is a reasonable internal control. The others are single-campaign figures with no control, and should be read as what happened rather than as what video caused.
What this study cannot tell you.
It is not a random sample. These are 39 engagements documented as case studies. Engagements that went badly or produced nothing measurable are less likely to have been written up, so survivorship bias is present and probably significant. Read every figure as a ceiling rather than an expectation.
Most figures are client-reported. Revenue, ROAS and cost-per-lead come from the clients running the media. VideoRep did not audit their accounts. Channel multiples are the most reliable numbers here because they come from platform analytics rather than from anyone's interpretation.
Almost nothing has a control group. The Coinbound comparison is the only near-controlled case, and even there topic and thumbnail were not held constant. Fyntra and Syroscape have credible internal baselines. The rest do not, so they show correlation and cannot establish that video caused the outcome.
The sample sizes are small. Five engagements underpin the channel-median finding and eight underpin the cost finding. Those are real recorded numbers, and they are also too few to generalise confidently to your business.
One vendor produced all of it. Everything measured was delivered by the same presenter. That controls for consistency and simultaneously means this cannot separate the effect of presenter-led video in general from the effect of this particular engagement model.
All 39 engagements.
Top recorded outcomes per engagement. Linked where a full case study is published. Quote or cite any of it; a link back is appreciated.
| Engagement | Recorded outcomes |
|---|---|
| Anagram | 111 finished training videos delivered across 32 milestones since 2023 36 months continuously active, with a new batch in production this week 24 hours from paid rush request to delivered videos for an enterprise customer |
| Boutique wealth advisory | 3x conversion rate vs industry baseline 2.28x CTR lift (6.64% vs 2.91%) ~50% cost-per-acquisition cut ($43.53 vs $81.93) |
| Buildium | 2.6x to 3.8x channel median views on my top three explainers #5 of 51 channel rank of the first video among all uploads since Apr 2025 11 explainer videos delivered across 9 contracts, raw files back in 1 to 3 days |
| BusinessLoans.com | 6+ months of positive ROAS on a single hero ad 10 ad assets delivered (5 core ads + 5 hook variations) 0 revisions needed on first delivery |
| Coinbound | 3.4x the views of the founder-presented video published the same week, on the same channel 16 days from contract start to published video on the Clickstrike channel |
| Critical Control | 9 videos delivered in under 7 days $12,000+ in production cost savings 50+ hours of internal team time returned |
| Crush The CPA | 38.8x the window median: the Gleim CMA review hit 15,607 views in 8 months on a 2,480-subscriber channel #1 of 92 channel rank of the top video, 73,270 views, from a six-video batch I presented 38 videos delivered across 3+ years, with course brands approving every one |
| Crypto platform (NDA) | 33 finished videos delivered in 8 weeks, verified file by file 2 formats 8 long-form explainers plus 25 vertical ads cut for split testing 5 stars on the review: "We will work together again in the future" |
| DemandIQ | 2 videos delivered (1 ad + 1 VSL) 1 VSL anchoring the paid funnel Pending specific paid-funnel performance numbers from Austin |
| DetailUp | 7 total videos delivered 5 + 1 + 1 ads, VSL, and confirmation 1 shoot filmed in a single production session |
| Electric Heroes | 22 ad variations delivered across 3 campaigns 3x+ ROAS sustained on Meta $6,000+ in production cost savings |
| The Elevation Group | 7 total videos delivered 5 + 1 + 1 ads, VSL, and booking confirmation 1 shoot filmed in a single production session |
| Enlightened LCS | 7 presenter-led videos across 5 product lines 40+ hours of internal production time saved $12,000+ in production cost savings |
| EyeFly Digital | 24 hrs shoot-to-handoff turnaround 4 assets delivered (1 full-length VSL + 3 ad variations) |
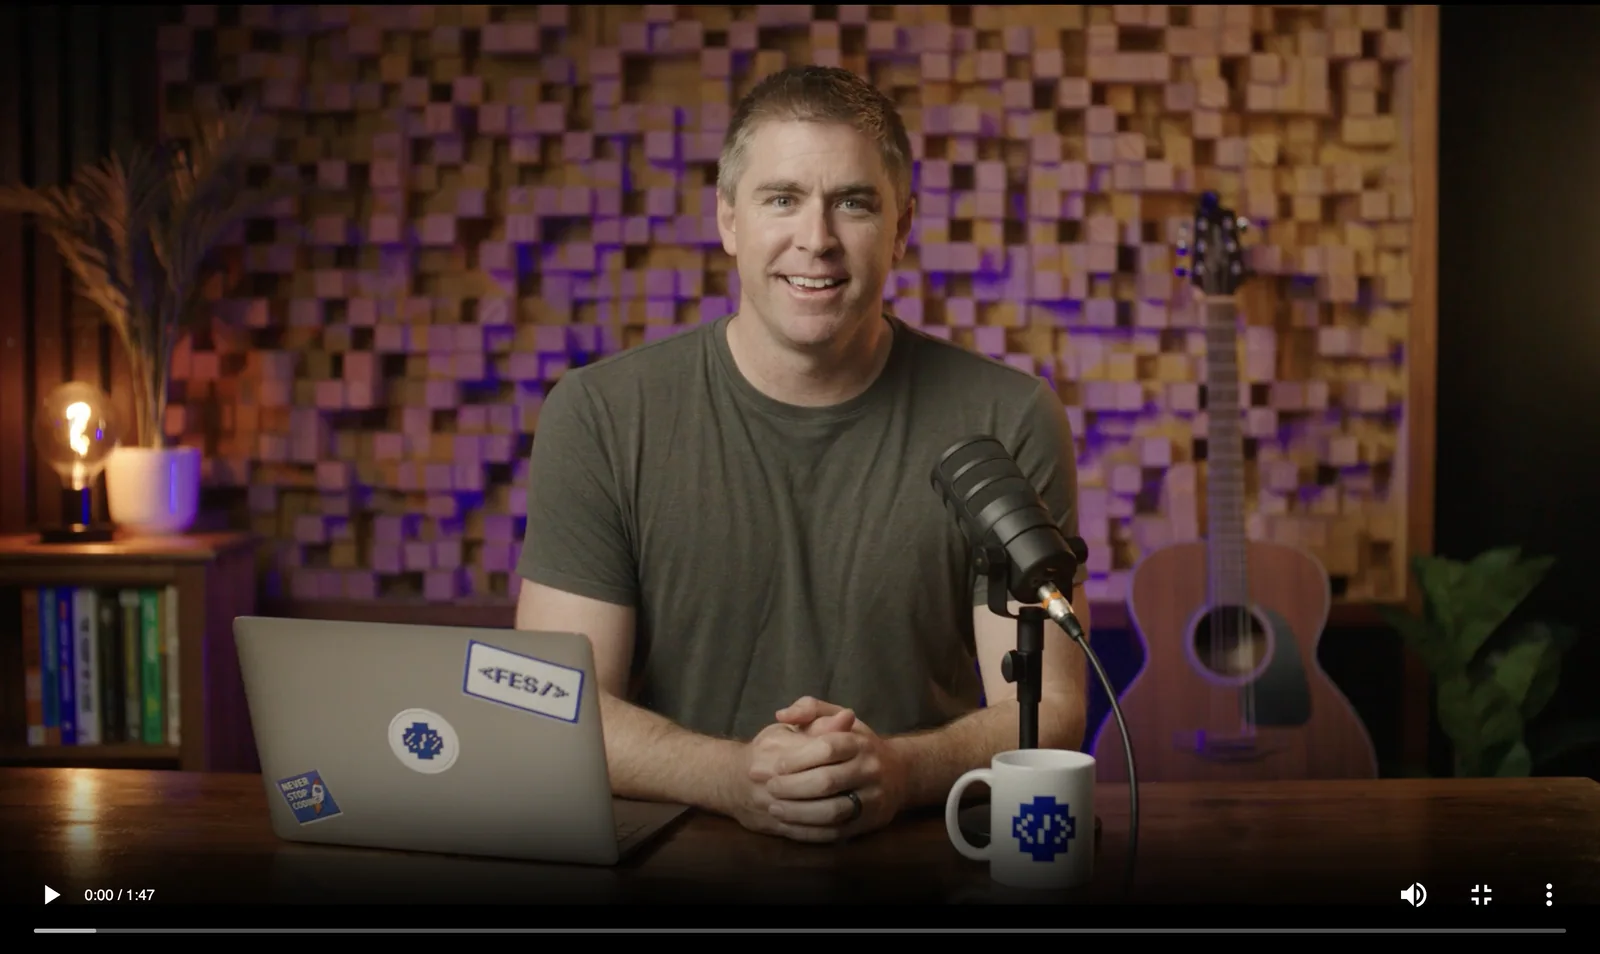
| FES Institute | 45+ videos delivered across two course modules and a follow-on ad 2 modules HTML crash course (~20 videos) and CSS crash course (~25 videos) 1 set full set design, professional lighting, sourced videographer for a single shoot day |
| For Those Who Served | 4 presenter-led explainer videos delivered 10x projected campaign ROI $25,000+ in production cost savings |
| FX Empire | 15+ broker review videos delivered 100% on-time delivery across the 15+ video broker review series $25,000+ in production cost savings vs in-studio production |
| Fyntra | 22 quality leads generated in 7 days 4x lift in lead generation vs previous AI-only ads $5-$6 cost per lead |
| GNO Partners | 37 multi-format ads (landscape, square, vertical) 1 full-length VSL anchoring the funnel $25,000+ in production cost savings |
| GoMage | #5 of 86 all-time channel rank of the anchor video, at 4.2x the all-time median 70% of the era long-form views came from his 6 videos (6 of 11 uploads) 15 assets live on the channel from 8 videos filmed: 6 long-forms plus 9 Shorts their team cut later |
| GraphLinq | 3 Web3 tutorial videos delivered (ERC404, swaps, ERC20) 4 days turnaround per video #1, #2, #3 view ranks among all 16 channel uploads in the tutorials' 12-month window |
| HBA | 7 total videos delivered 5 + 1 + 1 ads, VSL, and confirmation 1 shoot filmed in a single production session |
| HighGear | 59% average watched (Wistia B2B benchmark: ~50%) 105 sec average watch time on a 3-minute video 29% completion rate (7 of 24 viewers watched to the end) |
| INFUSE | 33 course lessons filmed across 12 milestones, 2022 to 2025 8 repeat contracts from the same hiring manager across three years 5 stars on the review: "The quality of the videos exceeded our expectations" |
| Mashvisor | 18.2x the channel window median: the top video is a top-10 upload of 310 all-time 25,028 combined views across the 11 videos (checked Aug 2026) 0 to 11 uploads: the channel was dark for 5 months, then 11 videos in 5 weeks |
| MedShadow | 101,628 views on Spleen Organ Health, MedShadow's top-performing video 52,600 MedShadow YouTube subscribers, up from 10,200 a year prior 15 presenter-led episodes delivered for the channel |
| Meltwater | 2 ABM-ready videos delivered with multiple cut-down variations First take usable footage after Meltwater's previous actor tests came back unusable Repeat work already planned off the back of a single project |
| Microsoft Design | 10/10 client-rated communication on pricing, timelines, and deliverables Ahead of schedule on first delivery, with little direction needed Repeat engagement on offer after a single delivery |
| OptiMonk | 60,264 views on OptiMonk's most-watched long-form video, 94x the channel's long-form median for its year 4 of OptiMonk's 9 most-viewed uploads of all time are VideoRep productions 30+ presenter-led videos delivered for the U.S. expansion |
| OtherWeb | 2 presenter-led videos delivered in days (Reg CF + product demo) 30+ hours of internal production time saved $7,000+ in production cost savings vs contractor route |
| Rezi | 1 long-form blog-to-video explainer (8m 39s) Multiple short-form clips for social 20+ internal production hours saved |
| Semrush | First cut approved by Semrush marketing with no revision round Repeat return engagement confirmed by Randy Mitchell |
| Simplify LLC | 76 presenter-led videos produced over 3 years 3,650 YouTube subscribers on Simplify LLC's channel 13,430 views on top performer "Advantages and Disadvantages of an LLC" |
| Suite Solutions Group | 7 presenter-led videos delivered in 6 days $14,000+ in production cost savings 1 funnel complete 4-1-1 video ad funnel ready to deploy |
| Syroscape | 3 Meta video ads delivered 78% lower Cost Per Sale vs Syroscape's other ad sets on the account Higher lead quality from human-led education before the click |
| TripleTen | 6 videos delivered across the bootcamp series ~2 years of continuous partnership with the same on-camera face 4 tracks QA, SE Remote Job, Cyber Monday, ad hooks |
| Unilever | 14 videos delivered in under 2 weeks 140+ internal production hours saved 7-10 day per-video turnaround |
| Verified Investing | 7 total videos delivered 5 + 1 + 1 ads, VSL, and confirmation 1 shoot all 7 videos filmed in a single production session |
| Workvivo by Zoom | 3.0x channel median views on the top Short, #8 of 63 in its window 9 days from approval to a live Meta lead-gen ad, Sep 2025 40+ presenter videos delivered across 10 bookings, 2023 to 2026 |
Not ready for a call?
How to Hire a B2B Video Presenter
If this data is useful, this is the practical companion. Free, no call required.
Want numbers like these for your own channel?
Tell me what you are measuring against today. I will tell you honestly whether presenter-led video is likely to move it.